15T1T1
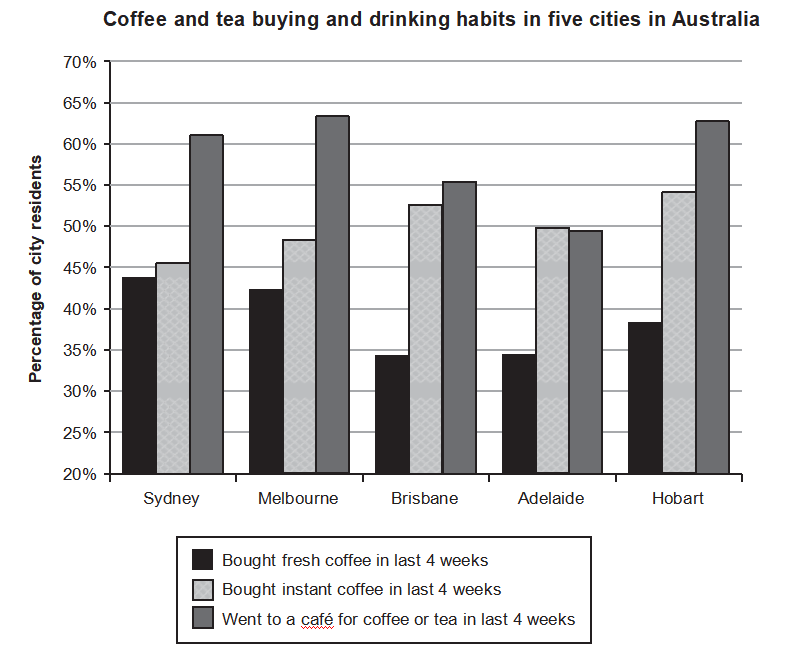 The bar chart compares the proportions of residents in five Australian cities who consumed coffee and tea in different ways during the last four weeks. (开头段的改写很不错)
Visits to a cafe are ( were注意时态) the dominant method of consuming coffee and tea in most cities, especially in Melbourne which has(had) the highest proportion of residents who visited a cafe in last month(略有一点重复,前面出现过Café,这里可以进行同义替换或者用指示代词 residents preferring this venue), at approximately 64%. The next highest figure are(was) in Hobart and Sydney, with similar percentage of around 62%. By contrast, Adelaide has the insignificant proportion for this category, at less than 50%. Grammar range & accuracy
For instant coffee purchases, Hobart has the highest proportion of residents choosing this method, at close to 55%. While(从句不独立出现) Sydney has the lowest ratio of residents who bought instant coffee recently with slightly over 45%.
Although/ when/ because
Roughly, over
Buying fresh coffee to make at home is the least popular option, as it has the smallest percentage across all five cities. The highest proportion of residents comes from Sydney, at(数据的表达方式可以再更多样化:数据做主语/ with+数据+doing sth,with 44% choosing ) approximately 44% . Whereas, Brisbane and Adelaide show similar results, both at just below 35%, the lowest figures on the chart.
C9T2W1
Answer
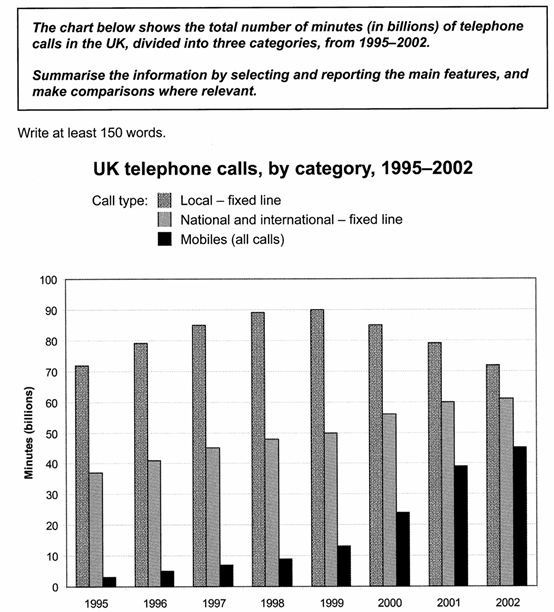
This bar chart displays the total calling time of telephones in the UK, broken down by three different types, between 1995 and 2002.
The amount of time spent that through the local call with fixed line was the dominant method in the whole period which recorded in the figure. In the beginning, there was a considerable increase in this category from 1995 to 1997, then remained stable in the following three years and reached a peak at around 90 billion minutes in 1999. After that a dramatic descend was observed and fell back to nearly 70 billion minutes in 2002.
Regarding the national and international fixed line calling, the amount of calling time in 1995 was below 40 billion minutes. However, a slow but continuous growth was witnessed in this period and reached the highest point in 2002 accounting for close to 60 billion minutes. The mobiles contribution had the most dramatic increase. An almost exponential rise could be seen in the mobiles usage. This method peaked at over 40 billion minutes in the final year 2002, rising from a negligible level in 1995.
Overall, the ranking of the three categories did not change by the end of the period, local fixed line call was still the major portion while mobiles remained the smallest. However, the local fixed line roughly remained stable while the national and international fixed line and mobiles had a significant expansion, though to different extents.
C18T1W1
Answer
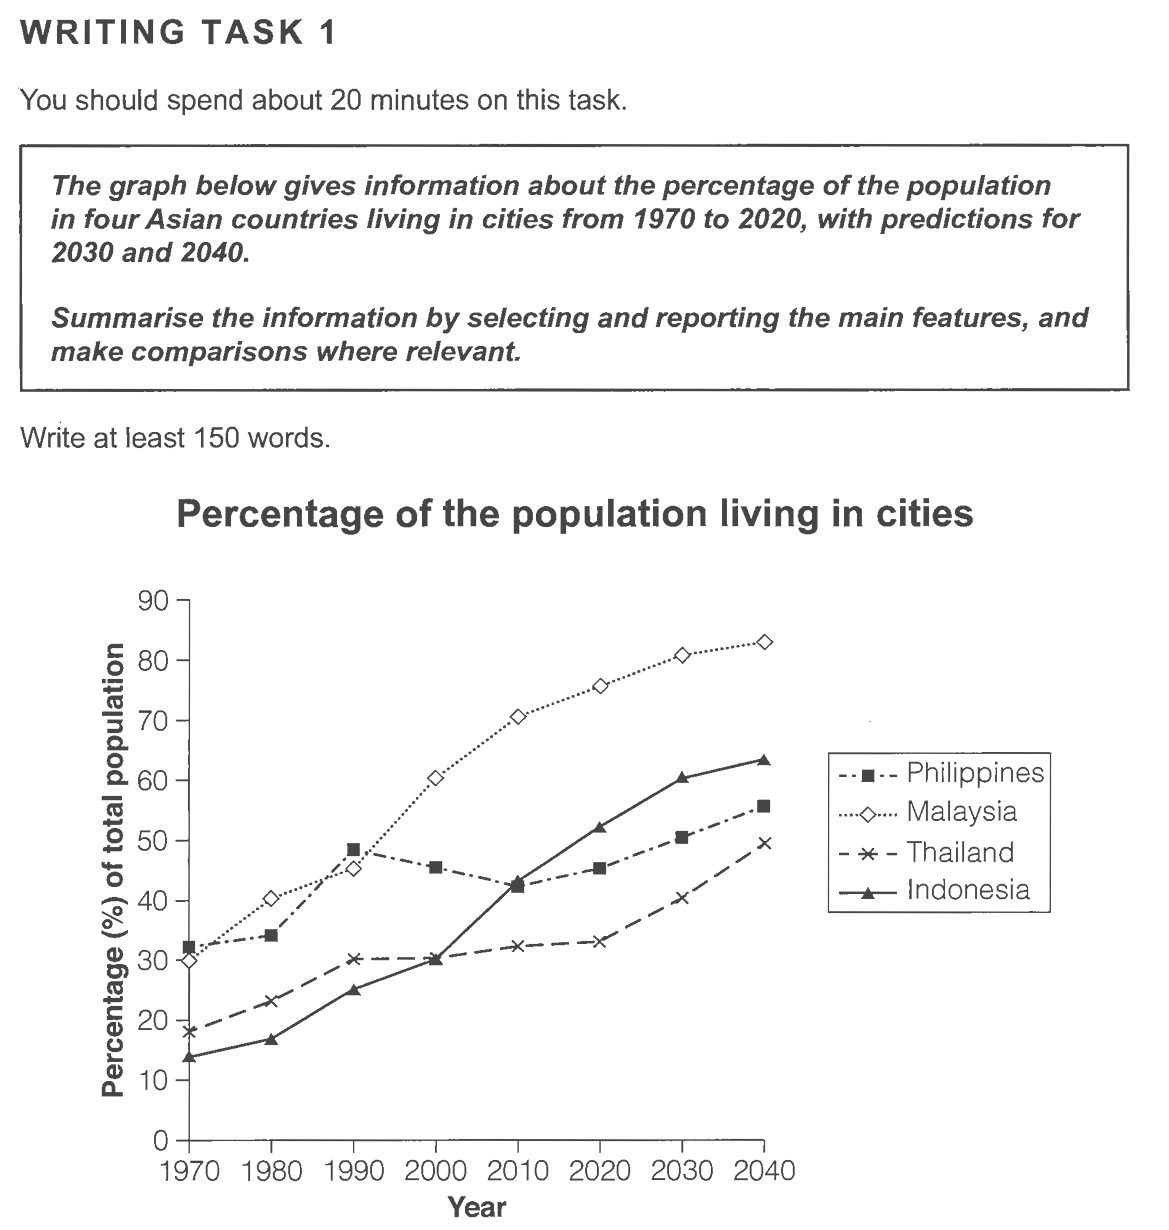
The line chart shows the statistic and prediction of the proportion of the population living in cities in four Asian countries between 1970 and 2040.
In Malaysia, The proportion of total population in cities increased dramatically from 30% in 1970 to 74% in 2020. There was a similar rapid upward trend from 14% to 50% in Indonesia over the same period, during which time the ratio of city residents tripled. In the Philippines and Thailand, the variations were more moderate in the past from 31% to 42% and from 19% to 30% respectively.
In terms of the predictions, all of these countries are estimated to rise up the fraction in urban populations to varying extents. However, the rankings are expected to remain the same in the future two decades.
To sum up, all four countries had increases in the past and also the future, while Malaysia and Indonesia are expected to reach the highest and the second highest. A larger gap between four countries is predicted in 2040.